Annualised Performance, Annualised Return
The annualized performance is the performance expressed in compound annual rate of return. For observation periods beyond 1 year, it is frequent to annualize the return figures, in order to be able to compare returns calculated over different horizons (1 year, 3 years, 5 years). For example, the annualized performance of a fund over 3 years is the (annual) return that the fund should produce 3 years in a row to achieve the 3-year return.
Benchmark
The benchmark of a fund is an index representative of the asset class segment the fund invests in. This reference makes it possible to evaluate the fund in terms of performance and risk. A fund that invests in European equities will be benchmarked by an index representative of the European equity class.
Beta
Beta is a relative risk indicator that measures the sensitivity of a financial asset to another asset, usually a market index. If a fund has a beta of 1 vs. its benchmark, this will result in a behaviour in line with that of the index; a beta greater than 1 means that the fund tends to amplify the movements of the index; a beta between 0 and 1, that the fund attenuates the movements of the index; a beta close to 0 that the fund is uncorrelated to the index; a negative beta, that the fund has a behaviour opposite to the index.
Liquidity
Percentage of assets that can be liquidated in one day, without processing more than 20% of the average daily volume of the last 30 trading days.
Net Asset Value, NAV
The Net Asset Value refers to the price of a fund unit. It is calculated on the basis of the total assets of the fund divided by the number of units.
Performance, Return
The performance or return of a fund is most often measured as the percent change in the amount invested.
Sharpe Ratio
The Sharpe ratio is a risk-adjusted performance indicator popularized by William F. Sharpe (Nobel Prize in Economics). It measures a fund’s ability to take the full advantage of the risk taken and convert it into performance. It is calculated by relating the annualized performance of the fund to its volatility. The ratio expresses the performance of the fund per unit of risk.
SRI – Summary Risk Indicator
Introduced by the PRIIPS regulation (EU 1286/2014), the SRI is a risk indicator represented on a scale ranging from 1 (less risky) to 7 (most risky). Just like the SRRI, it reflects a fund’s tendency to fluctuate upwards or downwards to a greater or lesser extent.
It is determined by combining a measure of market risk (MRM, rated from 1 to 7) and a measure of credit risk (CRM, rated from 1 to 6).
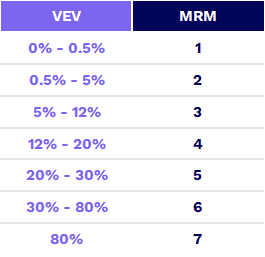
The MRM is calculated using an annualised volatility equivalent to a 97.5% VaR (VEV) as shown in the table below:

The CRM depends on credit ratings issued by approved rating agencies and also corresponds to a 99.9% VaR.
The SRI is determined by combining MRM and CRM according to the table below (as an example, a MRM of 4 and a CRM of 4 result in a SRI of 5).

SRRI – risk and return profile
The risk/return profile is symbolised by a scale from 1 to 7. The score provided is an estimate of the level of risk as well as the potential return of the fund.
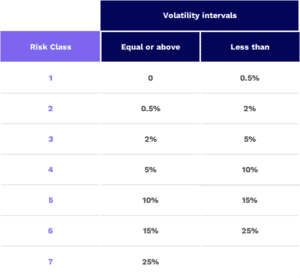
To classify a fund on this scale, the indicator used is its “volatility”, measured by the average variation in its value over the last 5 years. This indicator reflects the tendency of the fund to fluctuate, to a greater or lesser extent, up or down. When volatility is high, the potential for return is higher, but so is the risk of loss.
For example, a score of 5 indicates that the value of the fund has varied on average 10-15% above and below its average value.

Tracking error
Tracking error is the measure of the relative risk taken by a fund compared to its benchmark. It is given by the annualised standard deviation of a fund’s relative performance compared to its benchmark.
Volatility
Volatility is a risk indicator that measures the magnitude of the price changes of a financial asset. The more these changes deviate from their average, the more the volatility increases: the asset is then considered riskier. An increase in volatility means both a chance of higher gains and a risk of losing more. Volatility is calculated for individual stocks as well as for bonds, portfolios, indices, etc.
